 [Chart data]
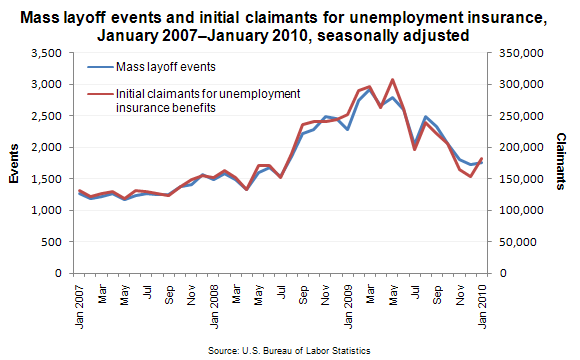
Both mass layoff events and initial claims increased from the prior month after four consecutive over-the-month decreases.
During the 26 months from December 2007 through January 2010, the total number of mass layoff events (seasonally adjusted) was 53,739, and the associated number of initial claims was 5,425,101.http://www.bls.gov/opub/ted/2010/ted_20100303.htm
Economic News Release Economic News Release-Mass Layoffs
USDL-10-0229 (monthly report)
MASS LAYOFFS -- JANUARY 2010
[Chart data]
Both mass layoff events and initial claims increased from the prior month after four consecutive over-the-month decreases.
During the 26 months from December 2007 through January 2010, the total number of mass layoff events (seasonally adjusted) was 53,739, and the associated number of initial claims was 5,425,101.http://www.bls.gov/opub/ted/2010/ted_20100303.htm
Economic News Release Economic News Release-Mass Layoffs
USDL-10-0229 (monthly report)
MASS LAYOFFS -- JANUARY 2010
Employers took 1,761 mass layoff actions in January that resulted in the sepa-
ration of 182,261 workers, seasonally adjusted, as measured by new filings for
unemployment insurance benefits during the month, the U.S. Bureau of Labor Sta-
tistics reported today. Each action involved at least 50 persons from a single
employer. Both mass layoff events and initial claims increased from the prior
month after four consecutive over-the-month decreases. In January, 486 mass
layoff events were reported in the manufacturing sector, seasonally adjusted,
resulting in 62,556 initial claims. Both figures increased over the month--the
first increases since August 2009 for events and since September 2009 for ini-
tial claims. (See table 1.)
During the 26 months from December 2007 through January 2010, the total number
of mass layoff events (seasonally adjusted) was 53,739, and the associated num-
ber of initial claims was 5,425,101. (December 2007 was the start of a reces-
sion as designated by the National Bureau of Economic Research.)
The national unemployment rate was 9.7 percent in January 2010, seasonally ad-
justed, down from 10.0 percent the prior month but up from 7.7 percent a year
earlier. In January, nonfarm payroll employment decreased by 20,000 over the
month and by 4,022,000 from a year earlier.
Industry Distribution (Not Seasonally Adjusted)
The number of mass layoff events in January was 2,860 on a not seasonally ad-
justed basis; the number of associated initial claims was 278,679. Over the
year, the number of mass layoff events decreased by 946, and associated ini-
tial claims decreased by 110,134. (See table 2.) Sixteen of the 19 major in-
dustry sectors in the private economy reported over-the-year decreases in ini-
tial claimants, led by manufacturing (-67,911). (See table 3.) Management of
companies and educational services reported January program highs in terms of
average weekly initial claimants while utilities reached a January program
low. (Average weekly analysis mitigates the effect of differing lengths of
months. See the Technical Note.)
The manufacturing sector accounted for 34 percent of all mass layoff events and
38 percent of initial claims filed in January 2010. A year earlier, manufac-
turing made up 38 percent of events and 44 percent of initial claims. Within
manufacturing, the number of claimants in January was greatest in transporta-
tion equipment, followed by food, fabricated metal products, and machinery.
Eighteen of the 21 manufacturing subsectors experienced over-the-year decreases
in initial claims, led by transportation equipment (-34,023). (See table 3.)
The six-digit industry with the largest number of initial claims in January 2010
was temporary help services. Of the 10 detailed industries with the largest num-
ber of mass layoff initial claims, school and employee bus transportation, dis-
count department stores, and nonresidential electrical contractors reached pro-
gram highs for the month of January. (See table A.)
Table A. Industries with the largest number of mass layoff initial claims in
January 2010, not seasonally adjusted
January peak
Industry Initial Initial
claims Year claims
Temporary help services (1) .................... 16,575 1998 26,224
School and employee bus transportation ......... 15,131 2010 15,131
Discount department stores ..................... 8,065 2010 8,065
Motion picture and video production ............ 7,966 1998 12,038
Professional employer organizations (1) ........ 6,462 2009 11,345
Highway, street, and bridge construction ....... 5,094 2000 9,680
Hotels and motels, except casino hotels ........ 4,248 2009 6,592
Automobile manufacturing ....................... 4,173 2001 21,093
Supermarkets and other grocery stores .......... 3,371 2009 3,978
Nonresidential electrical contractors .......... 3,299 2010 3,299
1 See the Technical Note for more information on these industries.
Geographic Distribution (Not Seasonally Adjusted)
All regions and all divisions experienced over-the-year decreases in initial
claims due to mass layoffs in January. Among the 4 census regions, the South
(-41,525) and Midwest (-31,010) registered the largest over-the-year decreases
in initial claims. Of the 9 geographic divisions, the East North Central
(-30,146) and the South Atlantic (-21,046) had the largest over-the-year de-
creases of initial claims. (See table 5.)
California recorded the highest number of initial claims in January, followed
by New York and Pennsylvania. Forty states experienced over-the-year decreases
in initial claims, led by Ohio (-13,850), Pennsylvania (-13,226), and Michigan
(-10,418). (See table 6.) In 2010, three states reached January program highs
for average weekly initial claims: North Dakota, Rhode Island, and Wisconsin.
Note
The monthly data series in this release cover mass layoffs of 50 or more
workers beginning in a given month, regardless of the duration of the layoffs.
For private nonfarm establishments, information on the length of the layoff is
obtained later and issued in a quarterly release that reports on mass layoffs
lasting more than 30 days (referred to as "extended mass layoffs"). The quar-
terly release provides more information on the industry classification and
location of the establishment and on the demographics of the laid-off workers.
Because monthly figures include short-term layoffs of 30 days or less, the sum
of the figures for the 3 months in a quarter will be higher than the quarterly
figure for mass layoffs of more than 30 days. (See table 4.) See the Technical
Note for more detailed definitions.
____________
The Mass Layoffs in February 2010 news release is scheduled to be released on
Tuesday, March 23, 2010, at 10:00 a.m. (EDT).
http://www.bls.gov/news.release/archives/mmls_02232010.htm
No comments:
Post a Comment